Palestinian Public Opinion Poll No. (9) for 2026
Palestinian Public Opinion Poll No. (9) for 2026
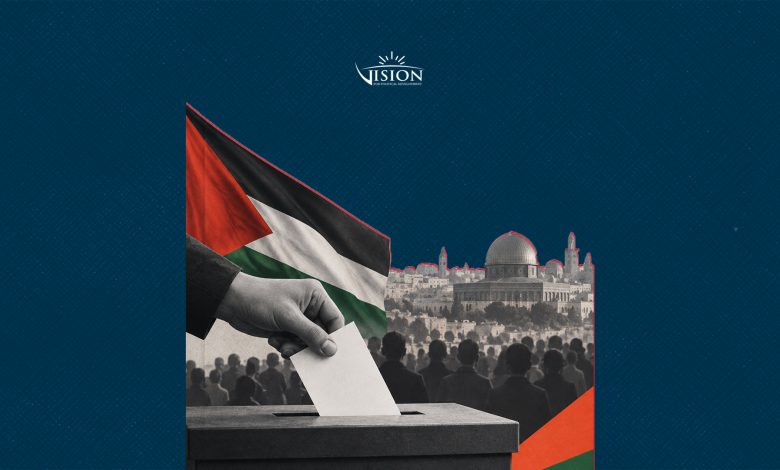
The Palestinian Public and Legislative and Presidential Elections
Prepared by: Vision Center for Political Development
September 2026
This poll was conducted from August 28 to September 7, 2026, examining Palestinian public attitudes toward holding and preparing for Palestinian legislative and presidential elections. The survey sample comprised approximately 1,370 respondents and covered the West Bank and the Gaza Strip.
Summary
- Expected turnout: 57.4% intend to vote, compared with 24.3% who do not intend to participate, while 18.3% remain undecided.
- Voting expectations in the Gaza Strip: Fatah 29.9%, Hamas 25.2%, independents and professionals 17.0%, and Dahlan-affiliated lists 14.2%, reflecting a closer contest among the main lists than in the West Bank.
- Fatah currents: A potential list led by Marwan Barghouti ranked first at 31.0%, compared with 20.3% for the official Fatah list led by Mahmoud Abbas and 17.9% for a Mohammed Dahlan list.
- Independent lists: 68.5% expressed support for lists comprising independents, activists, and civil society representatives, while 70.8% rejected lists based solely on families.
- National alliance–civil society: 56.7% said they would be willing to vote for a list comprising former political figures, academics, and independents without party participation.
- Broad national list: 41.8% said they might vote for such a list, compared with 44.5% who might not, while a scenario bringing together Fatah, Mahmoud Abbas, the Dahlan current, and other forces received support from only 34.7%.
- Hamas participation options: A standalone list comprising academics, experts, and prominent figures received the highest support at 48.0%, compared with 41.7% for an alliance with the Dahlan current and leftist and national forces, and 33.9% for an alliance with Fatah leaders opposed to Abbas.
- Factors threatening participation: The most prominent were the absence of a national-consensus list (62.8%), lack of confidence in candidate lists (60.8%), and lack of confidence in factions and parties (60.0%), making the composition of lists and alliances a key factor in turnout.